Dev widget
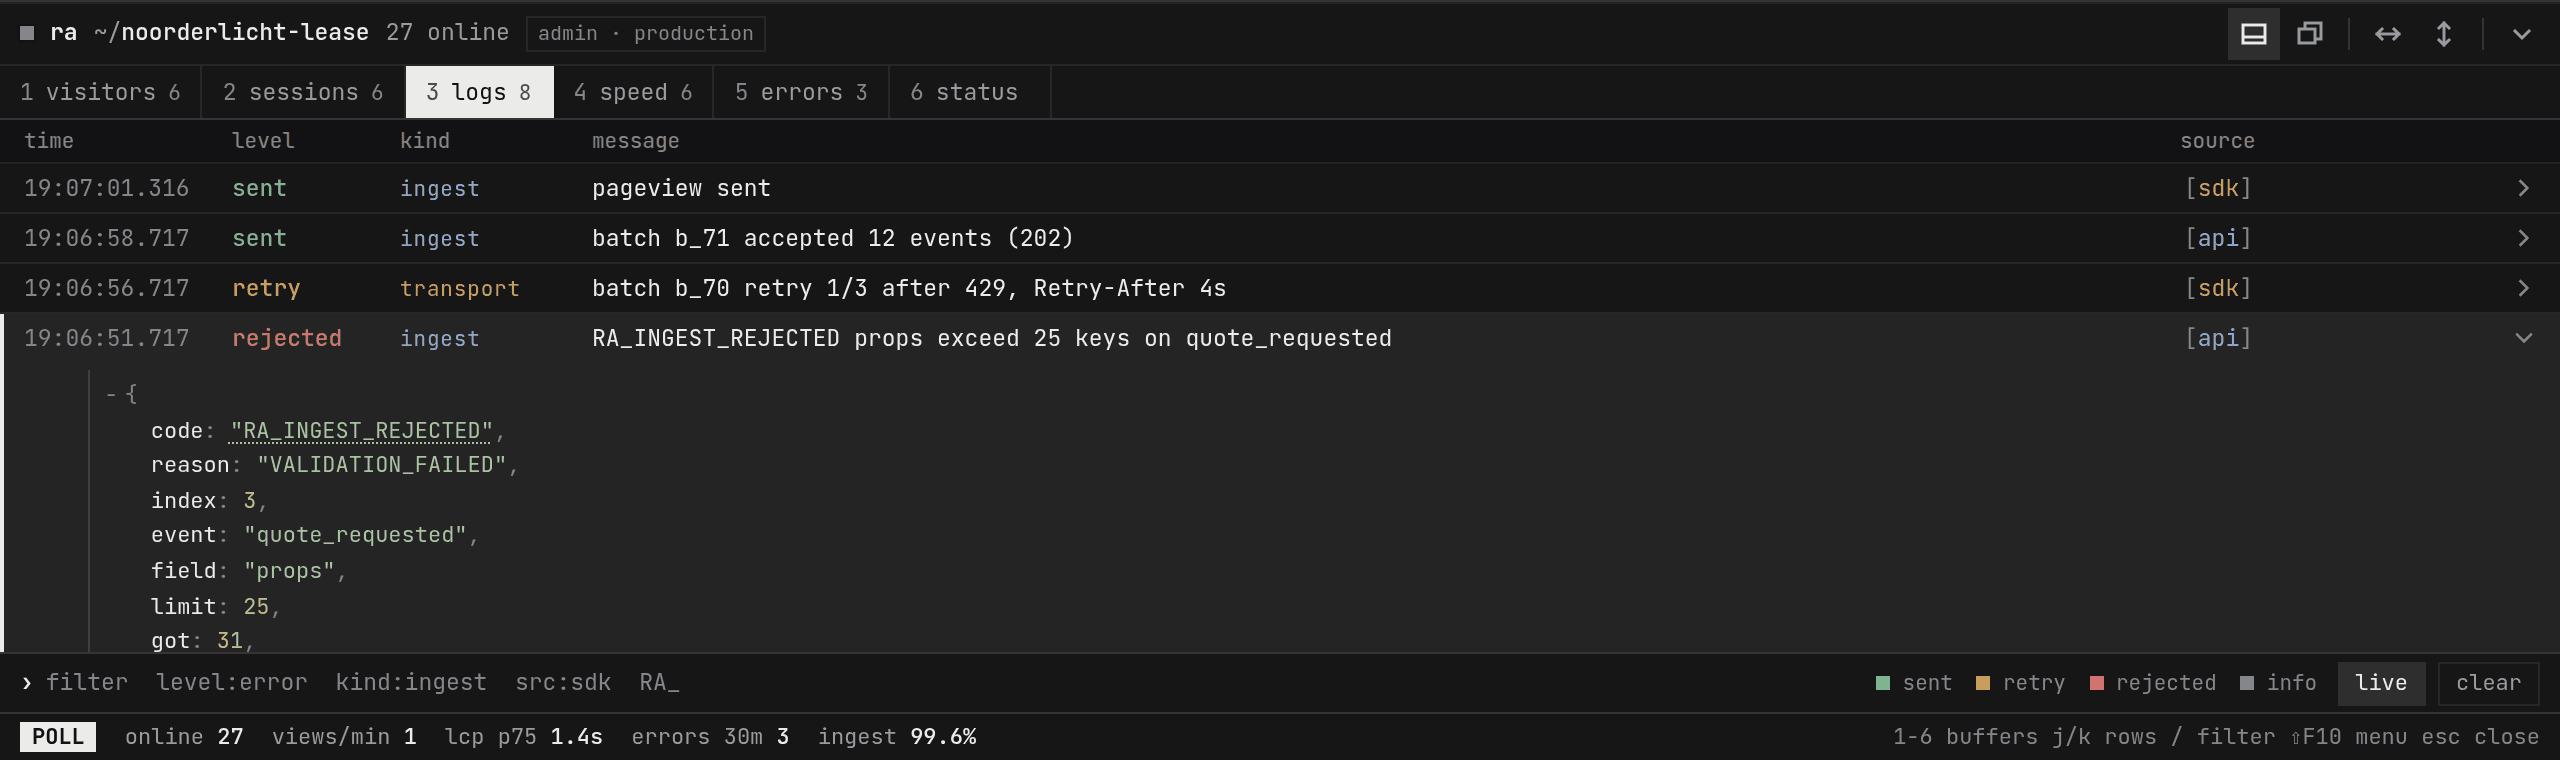
An overlay panel for admins on their own site, with online visitors, sessions, logs, speed per route, error groups and an overview. It ships as @spoar/devtools and visitors never download it.
@spoar/devtools puts a terminal-style panel on your live site, visible only to you. It is a separate package from @spoar/sdk, so the SDK's size budgets stay as they are and the widget releases on its own.
How it loads
Every entry renders a loader of under 1 KB gzip. On mount it calls GET /v2/widget/session with the browser's cookies. Only when that answers 200, which needs an admin session from signing in to the API, does it import the panel chunk. A visitor without a session gets a 401 and downloads nothing more.
The panel renders into a Shadow DOM root on one <ra-devtools> element. Its stylesheet is Tailwind compiled at build time and adopted into that root, so the host's CSS and the widget's CSS never meet. It adds no global styles, no classes on body and one global listener, for the keyboard shortcut.
The bootstrap answer carries a bearer token for that one project. The panel sends it on every call and fetches a new one 60 seconds before it expires. API: Dev widget describes every route the panel reads, including the live WebSocket that streams events, logs, visitors and sessions on one connection.
Install
npm install @spoar/devtoolsreact and react-dom 19 or later are peer dependencies of the React and Next entries. @spoar/sdk is an optional peer, for the analytics option.
Entries
| Entry | Use it for |
|---|---|
@spoar/devtools | mount(options) on any page. The panel chunk brings its own React. Returns a function that removes the widget |
@spoar/devtools/react | <Devtools /> in a React app. Uses the app's React |
@spoar/devtools/next | <Devtools /> in the App Router: a client component that loads the React entry with next/dynamic and ssr: false |
@spoar/devtools/fixtures | fixtureFetch() and createFixtureHandler(): sample data for every widget route, to try the panel before the API has the widget routes |
Next.js
import { Devtools } from "@spoar/devtools/next";

export default function RootLayout({ children }: { children: React.ReactNode }) {
  return (
    <html lang="en">
      <body>
        {children}
        <Devtools endpoint="https://api.analytics.remcostoeten.nl" project="remcostoeten.nl" />
      </body>
    </html>
  );
}
React
import { Devtools } from "@spoar/devtools/react";

import { analytics } from "./analytics";

<Devtools endpoint="https://api.analytics.remcostoeten.nl" project="remcostoeten.nl" analytics={analytics} />;
Any page
import { mount } from "@spoar/devtools";

const unmount = mount({ endpoint: "https://api.analytics.remcostoeten.nl", project: "remcostoeten.nl" });
Options
| Option | Does |
|---|---|
endpoint | The API origin. It must list your site in the project's allowedOrigins |
project | The project id |
analytics | An SDK client. Its drop and error outcomes show in the logs buffer as they happen |
fetch | A fetch replacement, such as fixtureFetch() |
catalogUrl | Where RA_* codes in the JSON tree link to, with {code} replaced. Without it they filter the logs on that code |
dashboardUrl | Adds "open in dashboard" to error groups, at <dashboardUrl>/issues/<id> |
Client reports
With analytics set, the panel shows dropped events and SDK errors in the logs buffer straight away. It also posts them to POST /v2/projects/:project/logs/client in batches of up to 50 every 5 seconds, but only when the project has widgetReports on. It is off by default; turn it on with PATCH /v2/projects/:project and { "widgetReports": true }.
Buffers
| Key | Buffer | Shows |
|---|---|---|
| 1 | visitors | Visitors of the last 30 minutes. A row expands to the session, trail, client, vitals, identity and bot signals |
| 2 | sessions | Sessions of the last 30 minutes with their trail and a human, engaged, suspect or bot tag |
| 3 | logs | Ingest, transport, pipeline, signal, job and auth rows, streamed live. A row expands to its JSON; visitor and session ids in it jump to that row |
| 4 | speed | LCP, INP, CLS and TTFB at p75 per route over 24 hours, colored by the Core Web Vitals thresholds |
| 5 | errors | Open error groups. A row expands to the stack, first seen, browsers and breadcrumbs |
| 6 | status | Online, today, ingest, bots, top pages, referrers, countries, the release and the resolved config |
Each buffer keeps up to 400 rows. The filter prompt at its foot takes key:value tokens and free text, such as level:error kind:ingest, geo:NL bot:>0.5 or lcp:>2.5s. -key:value excludes, and a word starting with / filters on the path; in the logs buffer it also narrows the stream on the API.
Keyboard
| Keys | Does |
|---|---|
| Ctrl+Shift+. | Opens and collapses the panel |
| 1 to 6 | Switches buffers |
| j, k | Moves between rows |
| Enter | Expands the selected row |
| / | Focuses the filter |
| Shift+F10 | Opens the selected row's menu |
| Esc | Collapses the panel to the pill |
Layout
The panel docks to the bottom at full width, resizable from its top edge, or floats, draggable by its header and resizable from its top-left corner. Full width and full height are toggles in the header. The layout is saved per origin in localStorage. Below 640 px wide the panel is a bottom sheet.